The following report consists of all the software engineering compensation data that we've collected in Q1 2024 within the United States that had associated gender and level mapping information. The following report represents a subset of the main Levels.fyi compensation dataset. Using these data points we are able to determine discrepancies in compensation by gender.
While approximately 16% of the data points from the US in our dataset were submitted by women, the representation of women in STEM fields in the US stands notably higher at 24%, according to a report by MIT. This reveals a slight deviation between our reported data and the representation within the actual population. Understanding this breakdown helps us identify any large outlier differences or reporting biases. For example, women may be less inclined to submit data points for fear of identification on a team where they are a minority. Below, you can see the percentages of women and men in tech roles at large companies globally giving us some more concrete stats on gender diversity within the industry.
| Company | % Women in Tech Roles | % Men in Tech Roles |
|---|---|---|
| Block | 30.6 | 68.7 |
| 29.3 | 69.4 | |
| Dropbox | 28 | 72 |
| Microsoft | 26.6 | 73.4 |
| 26.5 | 73.5 | |
| Apple | 24.9 | 75.1 |
| Splunk | 21.9 | 78.1 |
| Datadog | 21 | 79 |
| Cloudera | 19.5 | 80.5 |
| Uber | 15.7 | 84.3 |
Pay Gap By Level
The Levels.fyi Standard is a leveling hierarchy we've abstracted from company-specific names to make aggregation easier. Using this approximation for leveling, we model out the percentiles of total compensation by gender for software engineering across the US overall, San Francisco Bay Area, Greater Seattle Area, and New York City. For a deeper look, you can filter individual data points by gender on our compensation page.
The boxplots above highlight the differences in pay distributions by gender across different normalized career levels. Interestingly at the lower levels, in some cases women even out-earn men. But generally male engineers earn higher median salaries compared to female engineers. This gap gets more pronounced at higher levels in the US, which reflects similar observations we made in our 2020 report. The pattern of an expanding wage gap at later career stages is not new, but for Seattle and New York the highest disparity occurs at the second level right after the entry level. And while there is still a disparity later on for these locations, it’s less extreme than what’s present at the second level. However for San Francisco, there is an initial disparity evident right from the entry level position, which evens out at the second level, but is then amplified in the final two career levels.
One explanation for these gaps can be in the ability and desire to negotiate. This can also play a much larger role in subsequent promotions and career levels which can highlight why larger disparities appear as you advance.
Trends over time
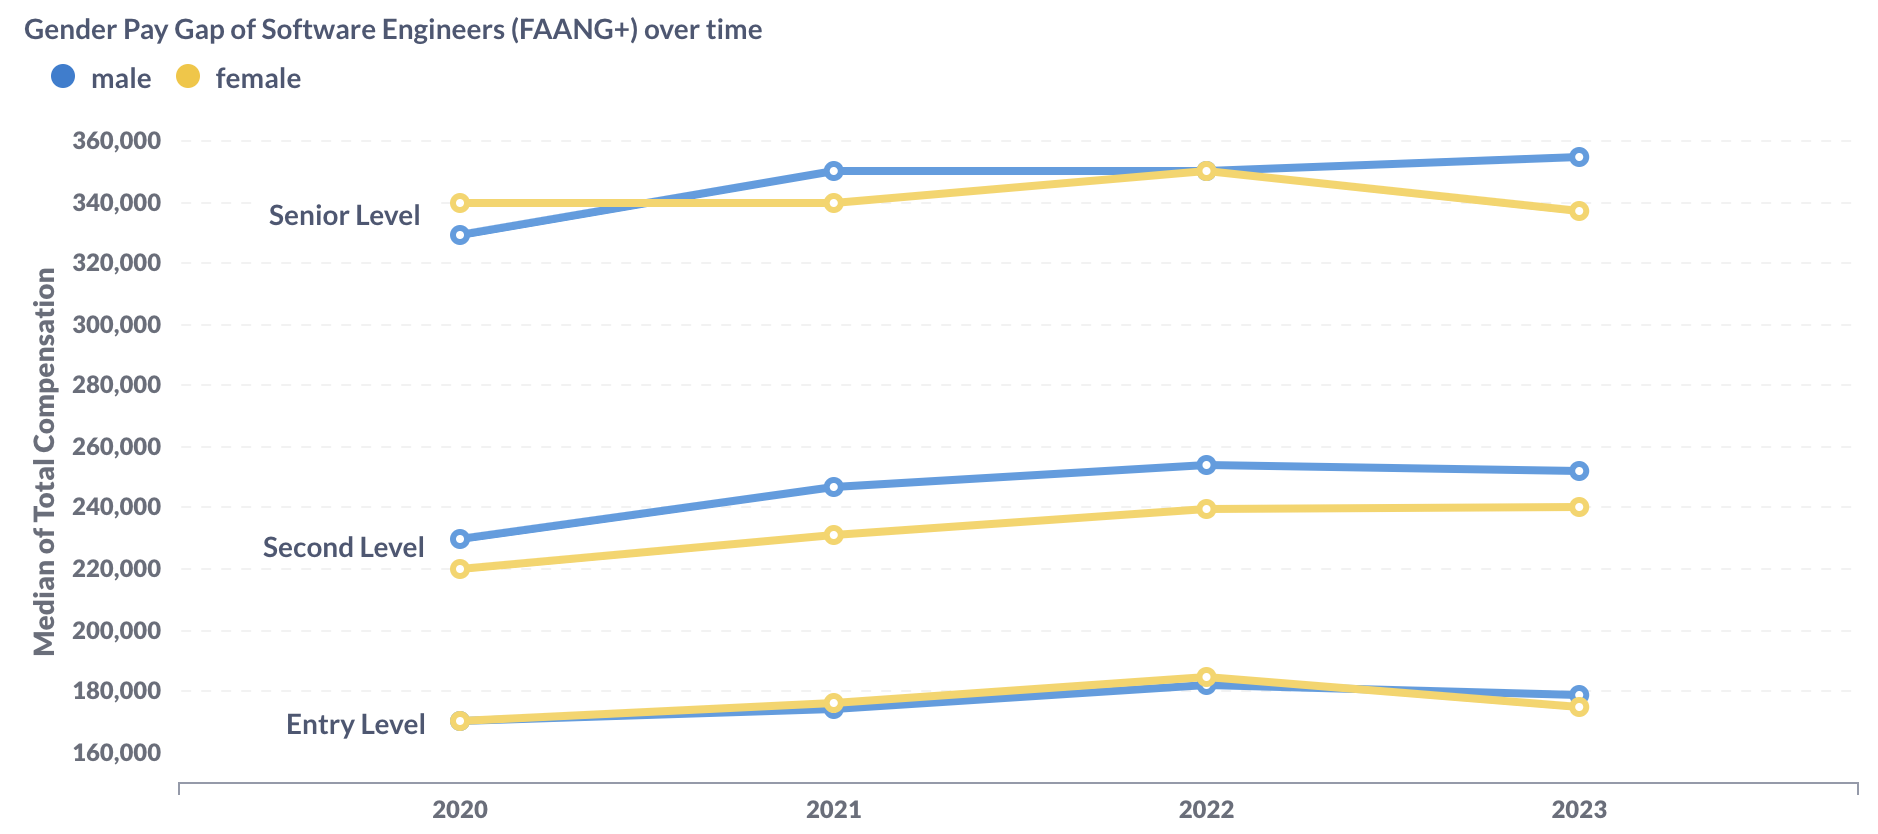
The graph below give us a peek into how the gender pay gap plays out at FAANG+ and other top-paying companies between 2020 and 2023.

At first glance, there doesn’t seem to be a significant pay gap between the genders. This could be a result of the highly standardized nature of compensation pay practices at larger tech companies. In previous years at the senior level, the gap seems to have closed. However, there are still some trends as you climb the ladder, where it becomes noticeable that women tend to fall behind, in particular, more recently as of last year.
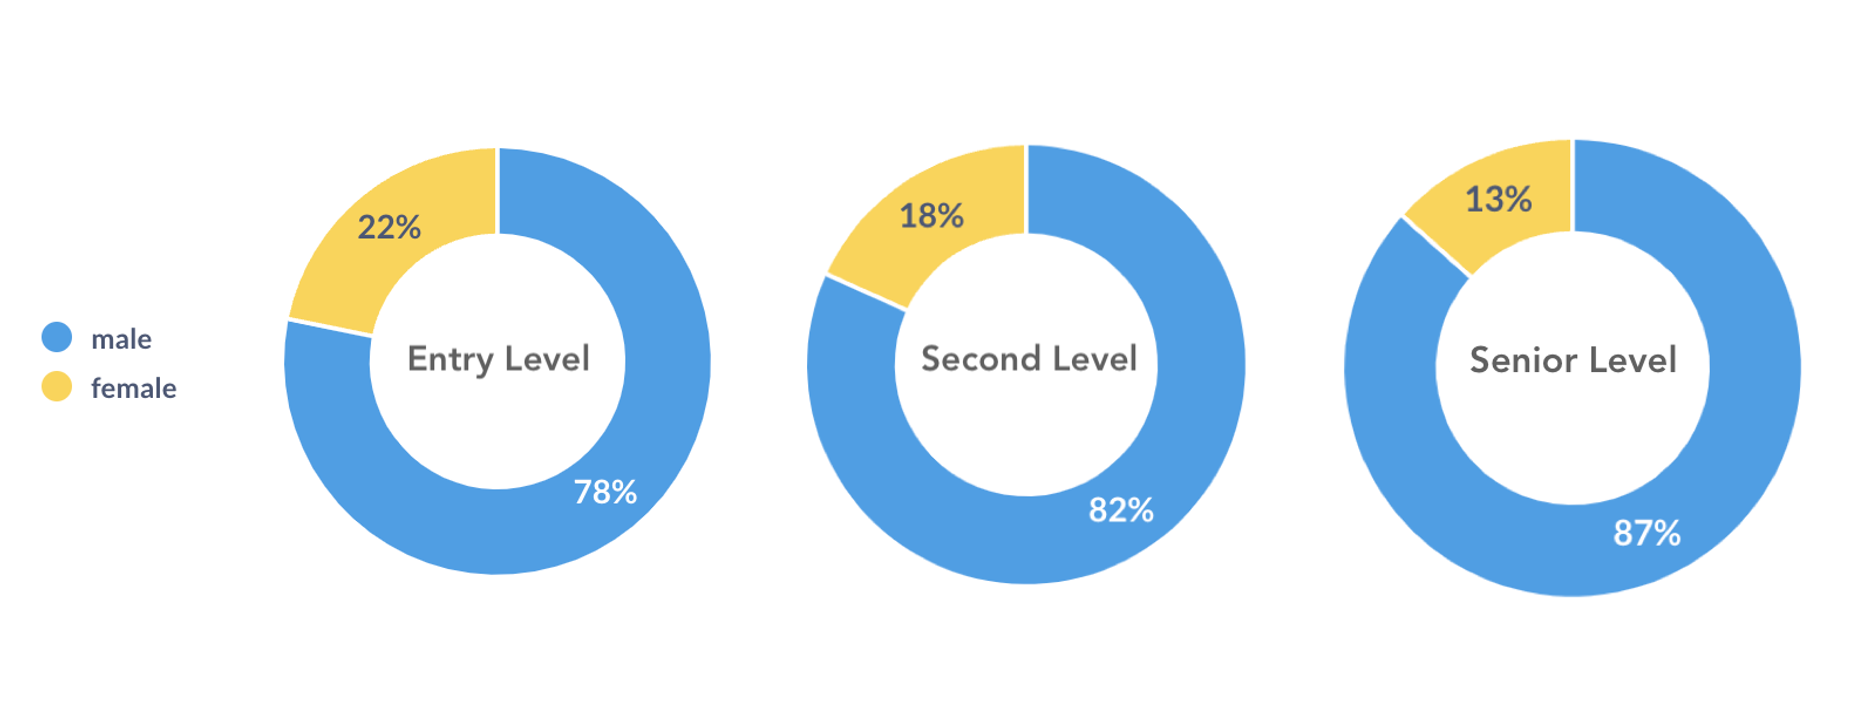
Additionally, according to our data, the gender breakdown of submissions varies across different levels. At the entry level, men represent 78% of submissions, while women represent 22%. This discrepancy persists as employees progress through their careers, with men comprising 82% of submissions at the second level and 87% at the senior level.

It's crucial to recognize that these differences can come from several different overlapping forces. For example, societal practices might make men and women act differently when it comes to taking risks. Generally men are often praised more for taking larger risks. It’s also key to note that the lower population of women at higher levels can have self-perpetuating effects. The fewer women there are, the fewer women may desire to be in those positions as well.
Our website as well as our negotiation service aim to help level this playing field so everyone is equipped with the data and leverage to negotiate the best outcome.
How can I contribute?
We're only as good as the data we collect. Contribute through the links below and help us spread the word, so we can create even richer tools for you and the community.
Resources Used
- Block - 2023 Workforce Diversity Report
- LinkedIn - Our 2023 Workforce Diversity Report
- Dropbox - Our 2022 Diversity Report
- Microsoft - Global Diversity & Inclusion Report 2023
- Google - Diversity Annual Report 2023
- Apple - Inclusion & Diversity
- Splunk - Diversity Annual Report 2022
- Datadog - 2023 ESG Report
- Cloudera - Diversity, Equality, & Inclusion
- Uber - Diversity and Inclusion

